Online tool aids oil spill response
Chemical oceanographer Sue Saupe said in 1990 and 1991, when she studied the long-term impact of the 1989 Exxon Valdez oil spill, she had trouble finding locations for productive study because the coastline of Prince William Sound was incompletely surveyed.
“I was working for the University (of Alaska Fairbanks) and we used a state database about the shorelines,” Saupe said. “We were doing what’s called a matched pair design — you try to pick two sites that are as similar as possible in habitat, but one got oiled and one didn’t. They knew where the oil had hit the shoreline, but when we got to these beaches, they didn’t match what the database said.”
Because the spilled oil was most likely to come ashore between minimum and maximum tide, the oil spill response studies needed to look at the intertidal zones. But Saupe said that intertidal shorelines were often excluded from the studies she found in 1989.
“Especially here in Alaska, where you have huge tide ranges, that’s where a lot of the activity occurs,” Saupe said. “That’s where a lot of the nutrients collect, and it’s a really important habitat for the sensitive life stages of fish. A lot of them hang out right near the shore and feed before they head out to sea.”
Saupe later found that many of the studies in the state database she used had not been made at low tide, so that researchers had not collected data on the areas submerged during their visits to the sites.
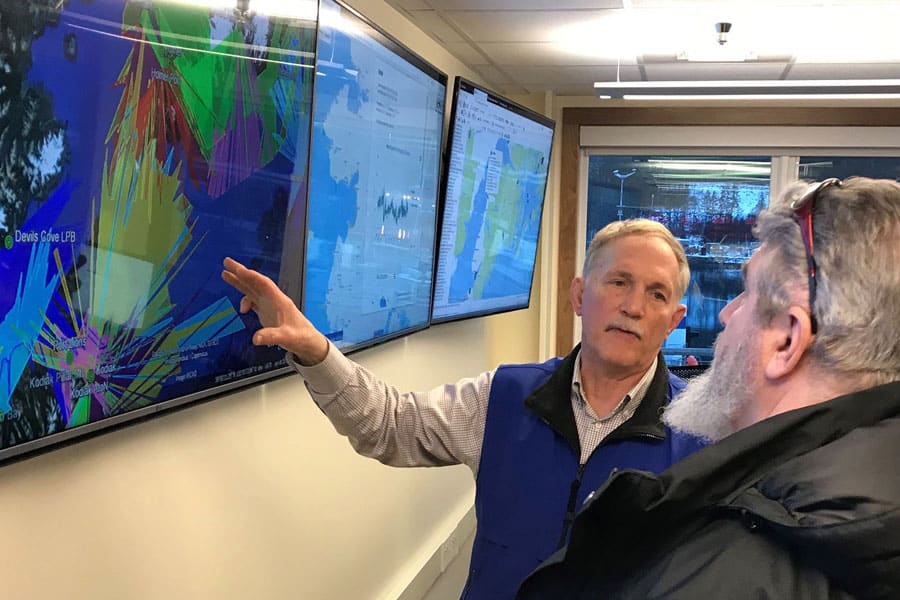
Saupe, now Director of Science and Research for the non-profit oil spill prevention group Cook Inlet Regional Citizen’s Advisory Council, has gathered aerial video and photography of all the coastline of the Kenai Peninsula, Cook Inlet, and Kodiak Island. This shoreline imagery has been layered over other data — including satellite and topographic maps, habitat studies, and real-time wind and temperature sensors — in an online visual database called the Cook Inlet Response Tool. All the imagery in the database was taken at low tide during neap-tide periods, exposing the crucial intertidal zone.
Saupe said that having a visual depiction of the entire area that would be affected by a Cook Inlet oil spill would aid responders because different types of coastline are impacted differently by oil. She gave the example of a steep and rocky shoreline, which would be damaged less than a salt marsh.
“(A salt marsh) is like a sponge,” Saupe said. “They just soak that oil in. So, one, they can retain it for years, if not decades. And responding in a salt marsh can be very detrimental. Those are the type of areas you might put more of your resources to protect. What habitats you have and where they are is really important in a planning process.”
In 2001 Saupe did her first shore imagery survey with CIRCAC using a protocol called shore zone. The early surveys were funded by the Kenai Peninsula Borough, the Exxon Valdez Oil Spill Trustee council, and the state’s Coastal Impact Assistance program.
The Shore Zone surveys attracted a variety of funders and interested parties. When it drew attention and funds from the National Oceanic and Atmospheric Administration and the National Park Service, the Cook Inlet Shore Zone survey was expanded into the statewide Alaska Shore Zone Partnership, a survey of the entire coastline of Alaska. Saupe estimated that 80 percent of the Alaska coast had been imaged by the Shore Zone partnership.
“Different entities were funding different parts of the state, and they wanted the data for different reasons,” Saupe said of the Shore Zone Partnership. “But we all agreed that the value of this habitat mapping was that it would all be done the same way, with the same protocols, but it would all be linked together and integrated so that it would be seamless to the user.”
Saupe said that in order to accomplish this goal, as well as “to integrate the Shore Zone habitat data and imagery with all of these dozens and dozens of other data-sets we need to access for oil-spill planning and response,” CIRCAC contributed its coastal video footage to the Alaska Ocean Observing System, a non-profit that maintains a database of public information related to coastal habitats.
This large set of geographical and ecological data — which Alaska Ocean Observing System has gathered from entities including state agencies, academic institutions, and non-profit groups like CIRCAC — is hosted in an online map-based interface.
The Cook Inlet Response tool, hosted in AOOS servers, is publicly available online. The Cook Inlet shoreline imagery and video currently available on through the AOOS interface was taken in 2009, when Saupe said that imagining technology had advanced far enough past the original 2001 video to make a re-survey desirable. Saupe estimates that the 2009 survey required between 30 and 40 hours of flight time in contracted helicopters with a four person crew.
In addition to preparation for possible future oil spills, the Cook Inlet Response tool has been used in a state statistical habitat study to find areas likely to host the invasive European green crab, as well as a joint habitat survey by CIRCAC and the National Park Service, and on behalf of the Coast Guard to identify beaches on which debris is likely to collect.
“If you’re interested in the coastal environment, there’s almost unlimited ways you can use this data to help you set up your studies,” Saupe said. “It points to where habitats are likely to exist, and it allows you to look at the imagery and see with your own eyes what the habitat looks like before you spend a lot of money getting out there, and you may find out that the habitats aren’t like what you were expecting.”
Reach Ben Boettger at ben.boettger@peninsulaclarion.com.